
— reviewed against the regs as they stand.
ΨMonkey — free in your browser
Calculate the Ψ-value for the junction you have actually drawn
Start from one of 38 ready-made SAP junctions, change the layers to match your detail, and watch Ψ and the fᵣₛᵢ temperature factor update as you type — modelled to BS EN ISO 10211, validated against the ISO test reference case.
Free to model on screen, no sign-up. Building Control-ready PDF £25 +VAT a junction, or unlimited on Monkey Pro.
Quick answer: a thermal bridge is a localised weak point — usually a junction like wall-to-floor or a window reveal — where heat escapes faster than through the surrounding fabric. Each junction’s extra loss is measured as a Ψ-value (psi value), in W/m·K, calculated to BS EN ISO 10211. At modern insulation levels junctions can carry 20–30% of a dwelling’s fabric heat loss.
Thermal bridges: the weak points in the fabric
A thermal bridge is a localised path through the building envelope where heat escapes more readily than through the surrounding fabric — typically at junctions: wall-to-floor, wall-to-roof, around windows and doors, at corners. Even with superb u-values everywhere else, poorly detailed junctions can account for 20–30% of a dwelling’s fabric heat loss.
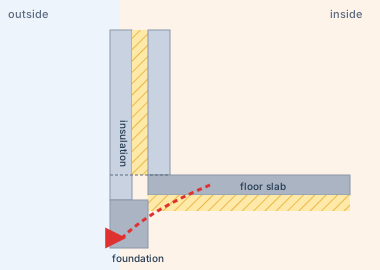
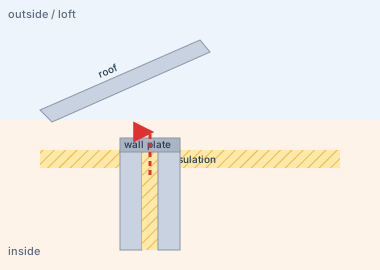
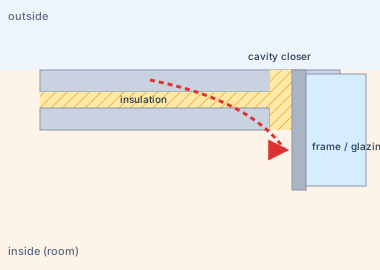
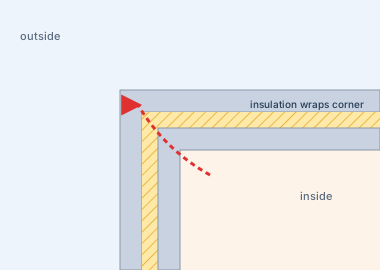
There are two kinds. Geometric bridges — like an external corner, which simply has more exposed surface area than the flat wall. And constructional bridges — where a high-conductivity material (a concrete slab edge, a steel lintel, an uninsulated cavity closer) pierces the insulation line and carries heat straight through.
Ψ-values (psi values)
Each junction type has a linear thermal transmittance, or Ψ-value, measured in W/m·K — the heat loss per metre of junction per degree of temperature difference. In SAP and HEM, every junction length is multiplied by its Ψ-value and summed into the heat-loss calculation.
A typical well-detailed junction sits around 0.02–0.08 W/m·K; a poor one can be 0.15–0.30. Because the lengths run for metres (a wall-to-floor junction runs the whole perimeter), small differences multiply quickly — which is why a SAP calculation with default Ψ-values can need noticeably more insulation or PV than one with calculated values. The number itself — its units, what a good value looks like junction by junction, and SAP’s default and notional figures from Tables K1 and R2 — has its own page: what is a psi value?
The maths in SAP (why a few hundredths matter)
In SAP, junction heat loss is simply length × Ψ-value. A detached house has roughly 50 m of wall-to-floor junction around its perimeter. At a calculated 0.05 W/m·K that’s 50 × 0.05 = 2.5 W/K. With SAP’s default for that junction — 0.32 W/m·K in Table K1 — it’s 50 × 0.32 = 16 W/K: a 13.5 W/K difference that must be made up in better walls, more insulation or bigger PV. Across all your junctions, that gap is often the difference between a comfortable pass and a design rework. It’s also why “measure the junction lengths, not just the wall area” is the first thing an assessor checks.
What a good detail looks like
The golden rules for every junction: keep the insulation line continuous, avoid bridging it with high-conductivity material, and close cavities with insulated closers. Concretely:
- Wall-to-floor — edge insulation under the slab that meets the wall insulation; a DPC can’t bridge the line.
- Window jamb/sill/lintel — an insulated cavity closer with the frame set against the insulation line; a metal lintel with no thermal break is a classic failure.
- Eaves and gables — loft or rafter insulation meeting the wall insulation without a gap.
- Corners — nothing to fix structurally, but they’re geometric bridges you can’t remove — they just need to be included in the calculation, not forgotten.
- Party walls, balconies, exposed floors — any element that penetrates the envelope needs a thought-through detail; balconies are the notorious one.
Each junction type has a page showing how to model it in ΨMonkey — from wall-to-floor and window jambs to balconies and exposed floors.
Which junctions cost you most
SAP / Approved Document L labels each junction with an “E-number” reference, and they’re all modelled in our free ΨMonkey psi calculator:
- Wall-to-floor (E5) — runs the whole heated perimeter; usually the biggest single contributor.
- Eaves (E9/E10) and gable (E11/E12) — where the wall meets the roof.
- Window jamb (E4), sill (E3) and lintel (E1/E2) — around every opening; jamb and sill lengths add up fast on glazed elevations.
- External corner (E13) and inverted corner (E14) — geometric bridges.
- Intermediate floor (E6) and party wall (E15) — for flats, terraces and semi-detached homes.
- Balcony (E8/E24) and exposed floor (E20/E21) — balconies and floors over voids are classic constructional bridges.
Your three options in SAP
- Default values — punitive, and they make passing harder and more expensive.
- Accredited/standard details — better, if your details exactly match the published ones (more on ACDs). Note that SAP 10 removed Accredited Construction Details over accuracy concerns, leaving manufacturer schemes or calculated values.
- Calculated Ψ-values — modelled to BS EN ISO 10211. Almost always the best result, often the cheapest route to compliance.
Calculate your own Ψ-values
Our free in-browser tool, ΨMonkey, models junctions with a finite-difference solver to BS EN ISO 10211 and gives you the Ψ-value and f_Rsi temperature factor. Use it to test your details — PDF reports for Building Control are £25 +VAT a junction, one junction per report. The process:
- Model the junction — paint the build-up (walls, floors, roof, insulation lines, cavities, DPC) on the grid.
- Solve — ΨMonkey runs the 2-D heat-flow calculation and returns the Ψ-value and the coldest-surface temperature factor.
- Iterate — move the insulation line, change the closer, compare details until the number is good.
- Export — the branded PDF carries the parameters, the result and a unique Report ID that Building Control can verify.
- Hand to your SAP assessor — calculated values slot straight into the SAP calculation as an alternative to defaults.
Condensation risk: f_Rsi
Thermal bridges aren’t just about heat loss. A cold internal surface at a junction invites condensation and mould. The temperature factor f_Rsi (0 to 1) measures how cold the worst internal surface gets; Building Regulations require f_Rsi ≥ 0.75 for dwellings. ΨMonkey reports it automatically — and the same junction that leaks heat is usually the one that risks mould, so fixing the detail fixes both.
That covers the inside surface at the junction. Condensation inside the wall or roof between the junctions — interstitial condensation — is a separate check, made on the build-up itself to BS EN ISO 13788: U-Monkey’s free condensation risk calculator runs it alongside the U-value, with the same f_Rsi check on the flat part of the wall or roof.
The bottom line
Get the U-values right, then get the junctions right — calculated Ψ-values are frequently the cheapest single route to a SAP 10 pass, and they de-risk your compliance pack. Model yours free with ΨMonkey — no subscription, no sign-up.