
Free forever · No sign-up · Nothing to buy
Launch TreeMonkey →Runs in your browser. Installs to your phone. Works offline.
One tonne of CO₂ is…
- 48 trees absorbing for a whole year
- 3,788 miles in an average petrol car
- 5 months of a typical UK home's energy
- 33 days of an average UK footprint
Now do it with your number.
Want the numbers themselves? The UK carbon conversion factors page publishes the 913 government factors a building project uses, with the year and version they came from.
Nobody can picture 2.5 tonnes of CO₂e
Not clients. Not planners. Often not the people making the decisions about buildings. TreeMonkey fixes that in one tap: any amount of carbon becomes a stand of trees absorbing for a year, miles in a petrol car, return flights, or the annual energy of a typical UK home. It's the fun end of the Monkey toolkit — the one that gets shared — quietly doing the serious job of building carbon literacy.
Four tabs, four ways in
Turn your project into numbers people feel
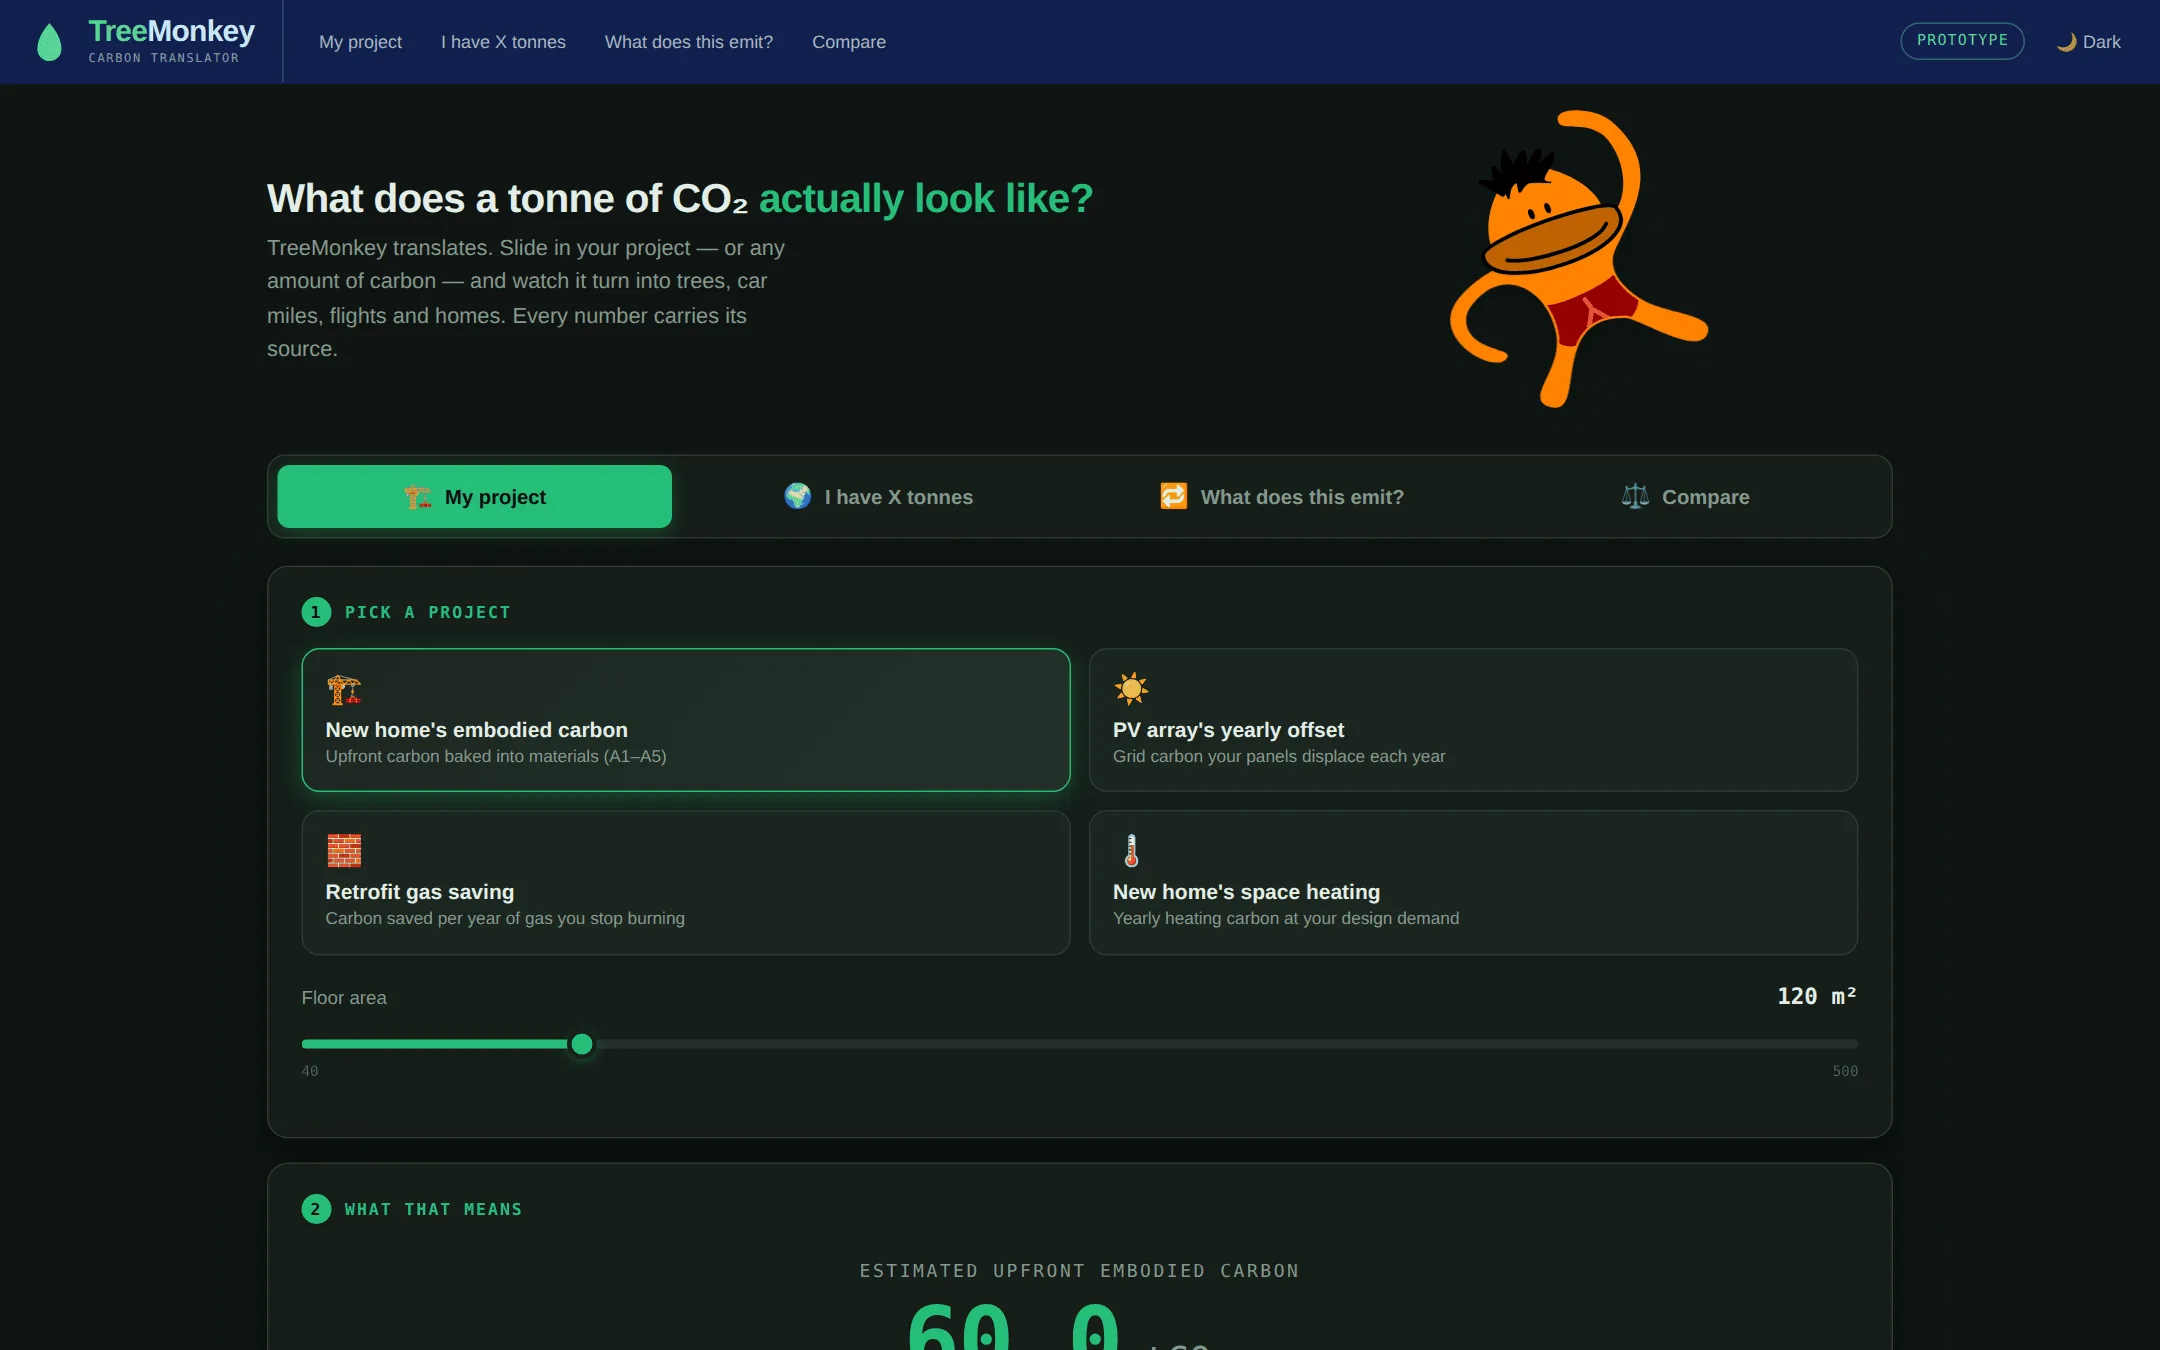
The "My project" tab is where it earns its keep. Embodied carbon from a floor area, a PV array's yearly grid offset, a retrofit's gas saving, a home's space-heat demand — all in trees, in seconds. It's a fast, honest way to frame a scheme for a planning submission, a client conversation or a design review. When you need the defensible figure, we turn it into a proper whole-life carbon and energy statement.
Heat pump vs gas boiler: about 81% less carbon — roughly 107 trees a year. One screen. Argument over.
Built to be shared
Every result becomes a designed card you can send anywhere: straight into WhatsApp or socials from your phone, as a downloadable image, or as a link that reopens the exact number. Each card carries a QR code back to the live tool — so your figure works on a poster, a planning pack, a slide or a school display, not just a screen. Someone scans it, and they're standing in the same forest you are.
How it works
- Pick a starting point. A tonnage, an everyday activity (miles, flights, kWh), or your own project.
- See it in real terms. Trees for a year, car miles, flights, homes — each with its source.
- Compare two options. Side by side, saving read off in one glance.
- Share it. A designed card with a scannable QR link, straight to WhatsApp or socials.
Honest about the numbers
TreeMonkey shows illustrative equivalents. It is not an offset scheme, not a carbon credit, and not a compliance calculation. Figures come from published UK sources — SAP 10.2 emission factors, DESNZ/DEFRA conversion factors, National Grid ESO grid intensity, Forest Research and LETI/RIBA benchmarks — each named on the result card. And the message stays straight: trees are the picture, but the real win is not emitting the carbon in the first place.
Who it's for
Homeowners and self-builders weighing up solar or a heat pump. Architects and developers framing a project's carbon for planning. Teachers, students, and anyone who's ever wondered what a tonne of CO₂ really means. Need those numbers turned into a stamped report? We're happy to help.
Quick answers
Common carbon questions, answered — each with the tool one tap away:
- How many trees does it take to offset a car?
- How much CO₂ does a car produce per mile?
- How much CO₂ is a return flight?
- How much CO₂ does a tree absorb?
- What is a UK household’s carbon footprint?
- What is the embodied carbon of a new house?
- Heat pump vs gas boiler: how much carbon do you save?
- How much CO₂ is a kWh of electricity?
Frequently asked questions
What does TreeMonkey actually do?
It translates carbon into things you can picture. Put in any amount of CO₂ — or an everyday activity, or your own project — and it shows the equivalent in trees absorbing for a year, petrol-car miles, return flights, UK homes powered and more. Every figure carries its source.
Is it accurate — where do the numbers come from?
They're illustrative equivalents from published UK sources — DESNZ/DEFRA conversion factors, SAP 10.2 emission factors, National Grid ESO grid intensity, Forest Research on tree absorption, and LETI/RIBA embodied-carbon benchmarks. Each result card names its source and year. It's a carbon-literacy tool, not a compliance calculation — for the real, stamped numbers we do whole-life carbon and energy statements.
Can it show my own project?
Yes — the “My project” tab turns a floor area into a new home's embodied carbon, a kWp figure into a solar array's yearly offset, a retrofit's gas saving into carbon avoided, and a space-heat demand into heating carbon — each in trees. The Compare tab puts two scenarios side by side, like a gas boiler against a heat pump.
Is TreeMonkey free?
Completely free, forever — no sign-up, no paywall, no report to buy. It's here to make carbon make sense. If you need those figures turned into a proper carbon or energy statement for planning or Building Control, that's what our team does.
How do I share a result?
Every result has a Share button. On a phone it opens your share sheet straight into WhatsApp, Instagram or Messages with a designed card attached; on desktop you get a downloadable image, a WhatsApp-ready text, or a link that reopens the exact result. The share card even carries a QR code back to the live number — handy for posters, slides and school projects.
Does it work offline / can I install it?
Yes — TreeMonkey installs to your home screen like an app and runs fully offline once loaded. It's a lightweight single page, so it's quick even on a phone on site.
Why trees — isn’t offsetting the wrong message?
Trees are the picture, not the plan. TreeMonkey is clear throughout that the real win is not emitting the carbon in the first place — reduce first, offset last. The tree count is there to make a tonne of CO₂ feel real, and to point people towards the energy hierarchy and lower-carbon choices.